
In the modern corporate landscape, organizations are flooded with more information than ever before. Yet, possessing massive data lakes and enterprise software licenses does not automatically translate into smart business decisions. The true bottleneck in data analytics is rarely a lack of information—it is the gap between theoretical knowledge and practical execution. Many professionals spend hours watching software tutorials or studying database architecture, only to freeze when confronted with a messy, real-world dataset.
Mastering tools like Power BI, Tableau, and SQL requires active problem-solving rather than passive observation. To bridge the gap between textbook concepts and boardroom impact, professionals must engage in targeted, scenario-based practice. This guide explores how structured business intelligence skill-building activities transform raw data skills into sharp, executive-level decision-making power.
Moving Beyond Theory to Practical BI Mastery
Most analytics training focuses heavily on interface navigation—teaching users where buttons are located, how to drag and drop visual elements, or how to write basic syntax. However, real-world data is rarely clean, perfectly structured, or free of anomalies. When an executive asks why monthly recurring revenue dropped in a specific region, knowing how to build a generic bar chart is not enough; you need the analytical intuition to trace discrepancies, model relational schemas, and extract actionable insights.
Why Hands-On Practice is the Ultimate Skill Multiplier
Moving from a passive learner to a proficient data practitioner requires shifting your approach from memorization to active execution:
- Simulating Real-World Friction: Practical drills force you to deal with missing values, duplicate entries, and poorly formatted timestamps that sanitized tutorial datasets conveniently omit.
- Building Analytical Muscle Memory: Regularly working through scenario-based problems helps you intuitively recognize which data model or visualization type best answers a specific business question.
- Connecting Tech to Strategy: Effective BI exercises train you to look past the software interface and focus on the core business metric—ensuring every chart, filter, and KPI directly supports operational goals.
What Are Business Intelligence Exercises and Why Do They Matter?
To truly understand the value of data practice, it helps to define what these drills actually entail. Unlike academic math problems or abstract coding tests, practical business intelligence practice problems are structured, scenario-based simulations designed to mirror real corporate challenges. They require practitioners to ingest raw, unstructured data, clean and model it, build functional analytical environments, and extract insights that drive business strategy.
The Skill-Building Shift: From Passive Viewing to Active Problem-Solving
Many professionals fall into the trap of tutorial fatigue—watching dozens of hours of video content on software navigation without retaining how to solve actual analytical hurdles.
- Active vs. Passive Learning: Watching an instructor build a dashboard creates an illusion of competence. Building the dashboard yourself—and troubleshooting the inevitable errors along the way—forces your brain to build genuine technical and analytical capability.
- Contextualizing Complexity: BI exercises introduce realistic constraints, such as conflicting stakeholder requirements, messy categorical data, and performance bottlenecks, preparing you for the realities of corporate data environments.
Bridging the Analyst-Executive Gap
Technical proficiency alone does not make a great data analyst. One of the primary reasons business intelligence exercises matter is that they train you to answer the ultimate boardroom question: “So what?”
- Translating Metrics to Action: Good exercises don’t just ask you to make a chart; they ask you to diagnose why customer churn spiked or how inventory turnover impacts cash flow.
- Sharpening Commercial Intuition: By repeatedly working through industry-specific scenarios, practitioners learn to speak the language of finance, operations, and marketing, turning raw dashboard metrics into compelling, strategic narratives.
Core Categories of Business Intelligence Skill-Building Activities
To build a well-rounded analytical skillset, professionals cannot rely on isolated software drills. Comprehensive development requires moving through a structured progression of exercises that cover the entire data lifecycle—from raw ingestion to executive storytelling. Organizing your practice into distinct operational categories ensures that you master both the technical architecture and the strategic application of business intelligence.
Data Ingestion, Profiling, and Hygiene
Before any visualization or predictive modeling can occur, raw data must be audited and cleaned.
- Handling Raw Anomalies: Exercises in this category focus on transforming messy CSV files, fixing null values, standardizing date formats, and removing duplicate entries using tools like Power Query or SQL.
- Establishing Data Integrity: Profiling drills teach you how to spot hidden data anomalies that could otherwise skew executive reporting and lead to flawed business decisions.
Data Modeling and Relational Architecture
A dashboard is only as strong as the database structure supporting it.
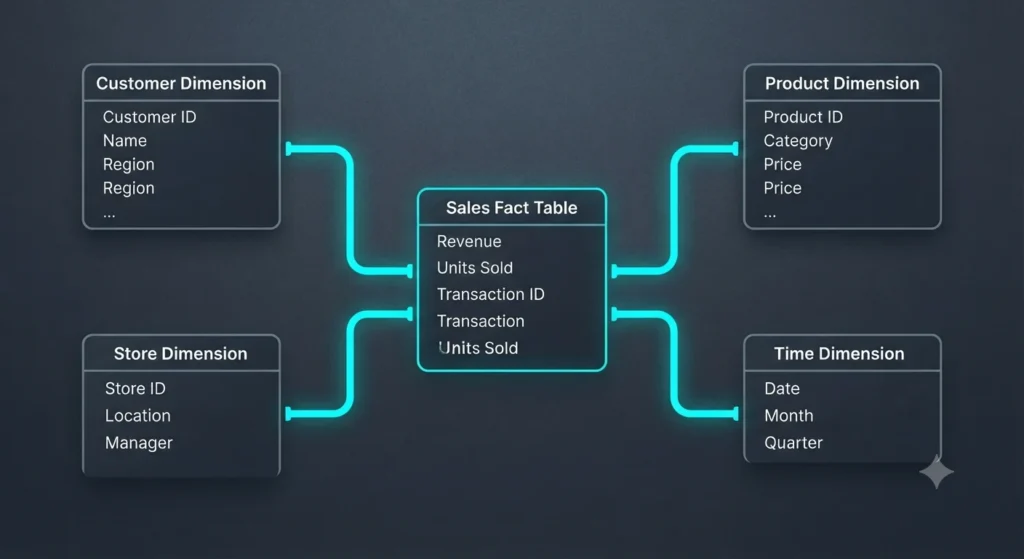
- Structuring for Performance: Modeling exercises train you to design clean star schemas, establishing proper primary and foreign key relationships between fact and dimension tables.
- Optimizing Query Speeds: Mastering these structural drills prevents sluggish dashboard performance and ensures that complex calculations execute seamlessly across large datasets.
Visual Analytics and Dashboard Design
Once data is clean and modeled, it must be communicated effectively.
- User-Centric Interface Design: These exercises focus on layout hierarchy, color theory, and minimalist design principles to ensure dashboards highlight key trends rather than overwhelming stakeholders with visual clutter.
- Interactive Filtering: Practicing with advanced date slicers, drill-throughs, and dynamic parameters teaches you how to let users explore data intuitively.
Predictive and Diagnostic Analysis
Moving beyond historical reporting into forward-looking analysis separates novice users from elite BI practitioners.
- Diagnostic Troubleshooting: Drills in this area require you to investigate why a particular metric shifted, tracing variances back to specific operational triggers.
- Forecasting and Modeling: Practicing rolling averages, exponential smoothing, and trend projections prepares you to help organizations anticipate future market shifts and business risks.

Hands-On BI Projects: 6 Practical Practice Exercises by Skill Level
Moving from theoretical understanding to true analytical fluency requires getting your hands dirty with real-world scenarios. Instead of relying on sanitized, perfectly structured toy datasets, practitioners need to test their skills against messy, multi-faceted business challenges.
The following six hands-on hands-on BI dashboard projects and power bi and tableau practice datasets are structured by progression level, designed to take you from foundational data hygiene all the way to advanced predictive forecasting.
Level 1 (Beginner): The Retail Sales Profiling Drill
- The Scenario: Your retail client has handed over a raw, unformatted CSV file containing six months of global transactions. The file is littered with formatting inconsistencies, missing product categories, and duplicate rows.
- Core Tasks: Load the data into Power Query or Tableau Prep. Standardize date formats, handle null values, remove duplicates, and build a foundational 3-metric summary dashboard highlighting Total Revenue, Top-Selling Product Categories, and Regional Sales Distribution.
- Key Takeaway: Master basic data hygiene and learn how to transform raw, chaotic files into a reliable reporting foundation.
Level 2 (Beginner): Departmental KPI Scorecard Design
- The Scenario: A marketing department needs a single-page scorecard to track campaign performance, but stakeholders keep asking for dozens of vanity metrics that clutter the view.
- Core Tasks: Select 4 core operational key performance indicators (such as Customer Acquisition Cost, Conversion Rate, Click-Through Rate, and Return on Ad Spend). Design a clean, minimalist dashboard utilizing basic date slicers and simple conditional formatting.
- Key Takeaway: Learn how to resist information overload and design user-centric interfaces that focus executive attention on metrics that actually matter.
Level 3 (Intermediate): Building a Star Schema in SQL
- The Scenario: A growing e-commerce company is experiencing massive dashboard slowdowns because all their transactional data lives in a single, massive flat table.
- Core Tasks: Perform sql and data modeling exercises by writing queries to break the flat table apart. Build a proper star schema featuring a central transactional Fact Table surrounded by clean Dimension tables for Customer, Product, Region, and Date, enforcing proper primary and foreign key constraints.
- Key Takeaway: Understand relational architecture to optimize query performance and ensure your downstream reporting models scale smoothly.
Level 4 (Intermediate): Customer Segmentation (RFM Analysis)
- The Scenario: The sales leadership team wants to identify their most valuable clients to launch a targeted VIP retention campaign, but customer data is fragmented across purchases.
- Core Tasks: Group customers using Recency, Frequency, and Monetary (RFM) metrics using SQL or advanced BI platform calculations. Segment the customer base into actionable tiers (e.g., Champions, At-Risk, Lost Customers).
- Key Takeaway: Move beyond basic reporting into behavioral segmentation, enabling businesses to direct marketing dollars where they yield the highest ROI.
Level 5 (Advanced): Automated Revenue Forecasting
- The Scenario: Executive leadership requires a forward-looking revenue model to anticipate quarterly cash flow fluctuations and potential customer churn.
- Core Tasks: Implement rolling averages, year-over-year comparisons, and exponential smoothing functions within your BI platform or Excel data model to project future sales trends and highlight variance against annual targets.
- Key Takeaway: Bridge historical business intelligence with predictive analytics, transforming your reports from rearview mirrors into proactive forecasting tools.
Level 6 (Advanced): Anomaly Detection and Real-Time Alerting
- The Scenario: Sudden drops in monthly recurring revenue or unexpected spikes in operational errors are currently catching your management team off guard days after they occur.
- Core Tasks: Configure advanced conditional formatting, statistical control limits, and automated threshold triggers within your reporting suite to flag anomalies instantly when live data feeds update.
- Key Takeaway: Transition your analytics practice from passive reporting to active, real-time risk management and automated operational oversight.
How to Incorporate BI Exercises Into Your Professional Workflow
Integrating business intelligence exercises into your weekly routine requires more than just carving out time to watch tutorials. To truly sharpen your analytical edge, you need a disciplined framework that mirrors real corporate challenges and bridges the gap between passive learning and executive-level execution.
The 80/20 Practice Rule: Balancing Theory and Execution
Many professionals fall into the trap of spending 80% of their time reading documentation or watching video walkthroughs and only 20% actually building.
- Inverting the Ratio: Flip this dynamic so that 80% of your skill-building time is spent hands-on—writing queries, modeling relationships, and debugging dashboard errors.
- Targeted Repetition: If you struggle with table joins or complex date-filtering logic, dedicate focused 30-minute blocks specifically to repeating those exact scenarios until they become second nature.
Simulating Real Corporate Friction
Clean, perfectly formatted sample datasets are helpful for learning basic interface navigation, but they do not prepare you for the realities of enterprise data infrastructure.
- Embracing Messy Data: Actively source raw, unstructured datasets from open-source repositories like Kaggle or government data portals. Force yourself to clean duplicate entries, resolve conflicting data types, and handle missing values without a tutorial holding your hand.
- Handling Ambiguous Requirements: Practice building dashboards based on vague stakeholder prompts. Instead of being told exactly what chart to make, start with a business question (e.g., “Why are profit margins shrinking in the western region?”) and build the analytical path from scratch.
Mastering Executive Storytelling and Peer Reviews
Technical accuracy is only half the battle; the best BI practitioners are master communicators who can translate complex data models into concise business narratives.
- The 2-Minute Summary Rule: Challenge yourself to condense a multi-layered dashboard analysis into a 150-word executive brief or a 2-minute verbal presentation that highlights core findings and actionable recommendations.
- Peer Critiques: Share your practice projects with fellow analysts or mentors to receive constructive feedback on visual hierarchy, color choices, and potential blind spots in your data logic.
Strategic Integration: The Role of BI Exercises in Enterprise Digital Transformation
As modern organizations modernize their operations, the success of a digital transformation initiative rarely hinges solely on migrating to cloud data warehouses or purchasing enterprise software licenses. True transformation requires a cultural and operational shift toward widespread data literacy. Integrating structured business intelligence exercises into your organization’s training programs ensures that employees across all departments move from passively consuming reports to actively driving data-backed decisions.
Fostering a Culture of Data-Driven Agility
When teams regularly engage in practical analytics drills, organizations build institutional resilience and cross-functional fluency.
- Democratizing Analytical Problem-Solving: Regular training empowers non-technical managers and department leads to interrogate dashboards independently, reducing bottlenecks where every minor question requires an escalation to the central data team.
- Accelerating Operational Response Times: Teams trained in hands-on data hygiene, modeling, and diagnostic analysis can identify workflow bottlenecks, supply chain shifts, or customer churn patterns in real time, drastically shortening the loop from insight to action.
Scaling Self-Service BI While Maintaining Governance
As decentralized business units build their own reports, organizations often face the challenge of “shadow data”—discrepant metrics and conflicting KPIs generated by siloed teams.
- Standardizing Best Practices: Embedding standardized BI exercises across the enterprise ensures that every business unit adheres to uniform data modeling standards and metric definitions.
- Eliminating Reporting Silos: Structured training bridges the gap between centralized IT governance and decentralized business execution, ensuring that self-service reporting remains accurate, scalable, and fully aligned with overarching enterprise goals.
Frequently Asked Questions (FAQs)
What are business intelligence exercises?
Business intelligence exercises are structured, scenario-based simulation drills designed to train individuals in the core pillars of data analysis—including data ingestion, hygiene, relational modeling, dashboard design, and predictive forecasting. They simulate real-world corporate challenges rather than relying on abstract math or academic theory.
Where can I find practice datasets for Power BI and Tableau?
Practitioners can source raw, unstructured CSV files and practice datasets from open-source repositories such as Kaggle, Google Dataset Search, and government data portals. These platforms provide the messy, real-world data necessary to build effective hands-on analytical projects.
How do SQL and data modeling exercises improve reporting performance?
Writing SQL queries and building proper star schemas (connecting fact tables to dimension tables via primary and foreign keys) prevents query slowdowns and eliminates data discrepancies. Proper relational architecture ensures that complex calculations execute efficiently even across massive enterprise datasets.
How can non-technical managers benefit from BI exercises?
By engaging in practical BI training, managers learn how to look past surface-level vanity metrics, interrogate dashboard visualizations effectively, and translate complex data trends into clear, strategic decisions. This builds strong commercial intuition and eliminates reliance on guesswork.